


Crafting Dynamic Reports: From Power BI to Paginated Masterpieces
In the realm of data analysis, the ability to transform raw information into actionable insights is paramount. With Power BI, we have the tools to not only visualize data dynamically but also to delve deeper into the intricacies of our datasets through paginated reports. In this guide, we’ll embark on a journey from crafting a compelling Power BI report to seamlessly integrating it into a polished paginated masterpiece.
Creating a Dynamic Power BI Report
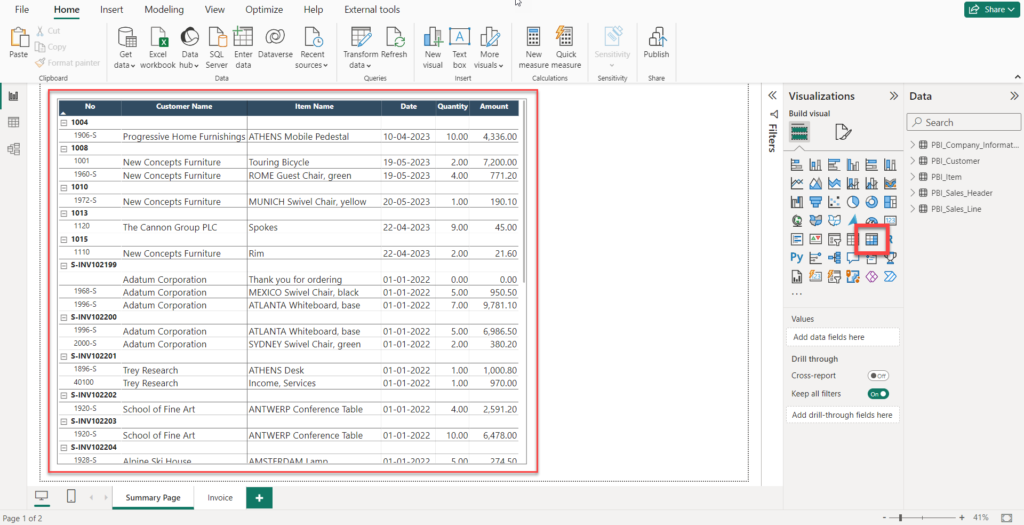
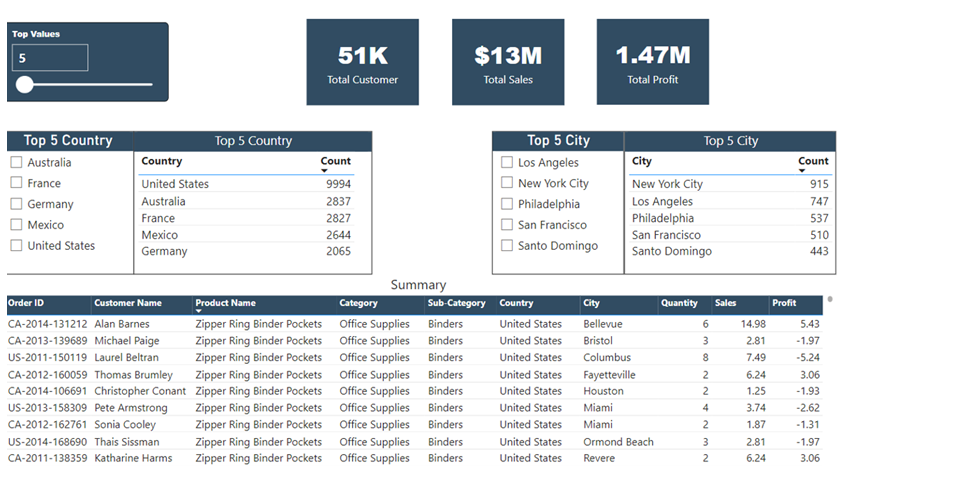
In our quest for insights, we start by harnessing the capabilities of Power BI to create a dynamic and visually engaging report. Leveraging data from diverse channels, we meticulously design a matrix table to analyze sales metrics. Once our masterpiece is complete, we seamlessly transition to the next phase by publishing it to our workspace.
Constructing a Paginated Report
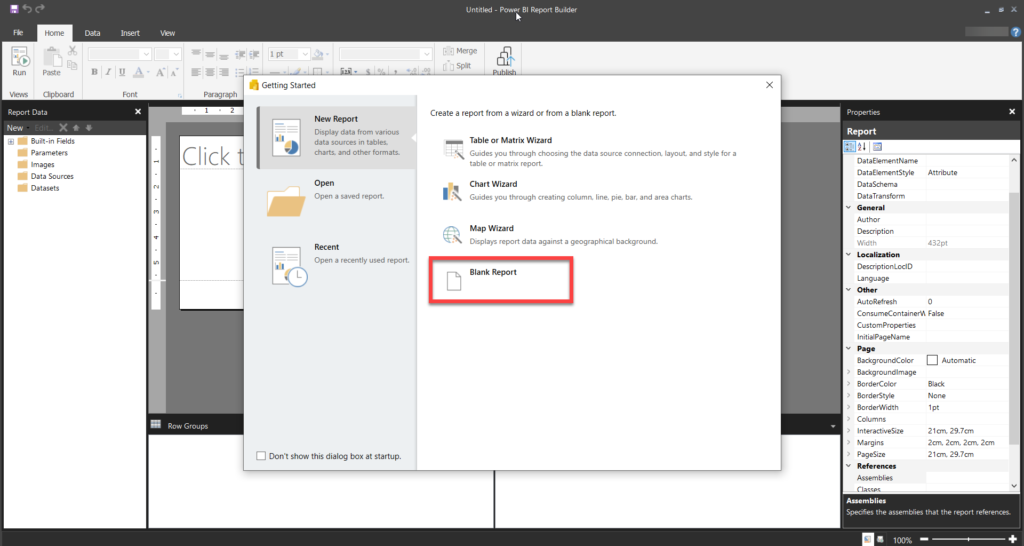
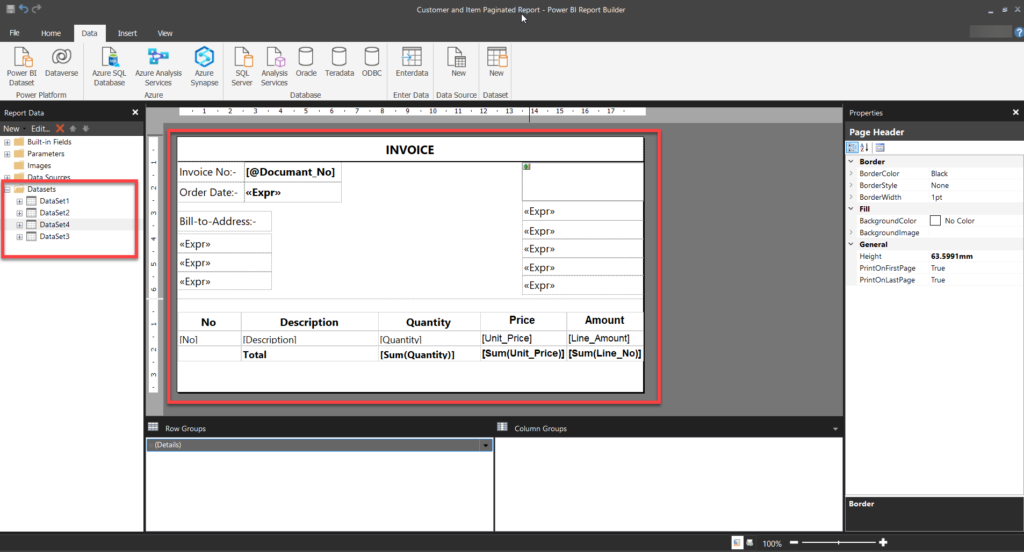
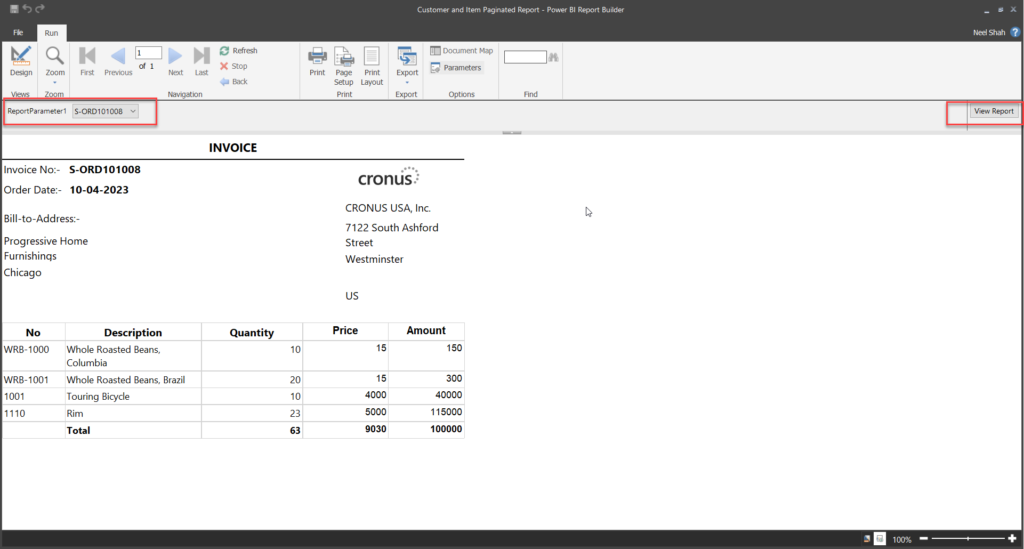
With our Power BI report serving as the foundation, we now embark on the creation of a structured paginated report. Beginning with a blank canvas, we carefully select our Power BI dataset and handpick the essential fields for our objective—creating a comprehensive Sales Invoice report.
Start by navigating to the Paginated Reports section in the Power BI service. Click on “Create” to initiate a new report. You’ll be presented with a blank canvas ready for your design.
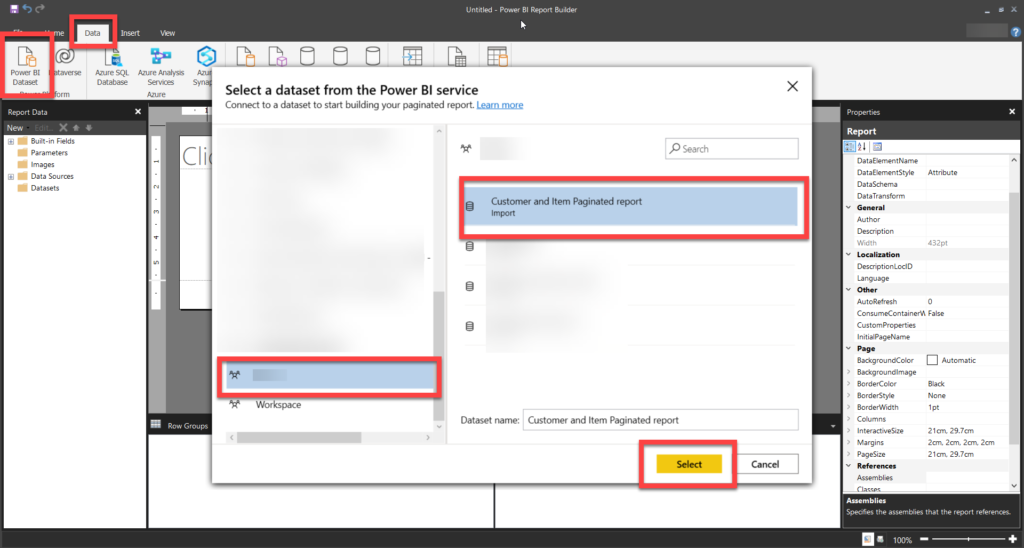
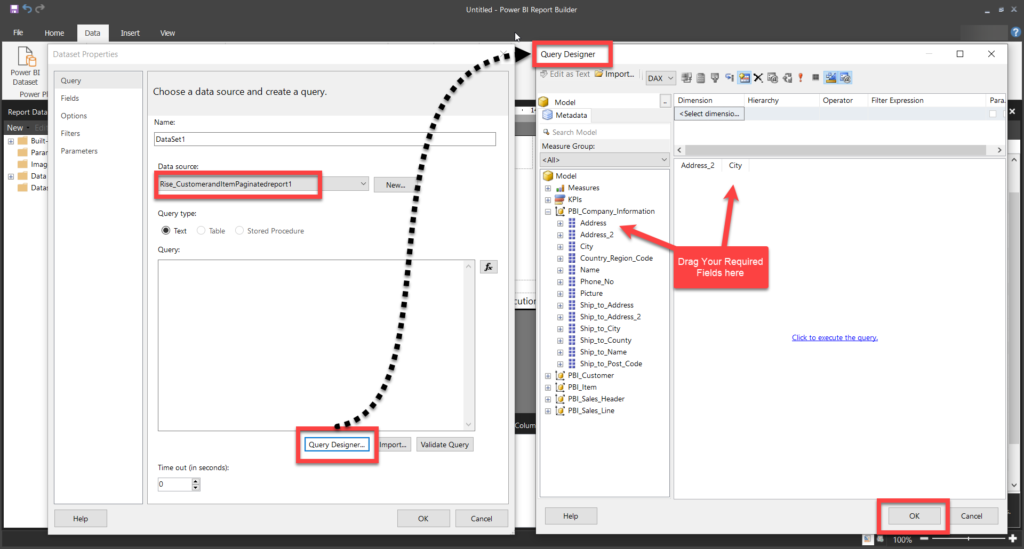
In the Query Designer, select the dataset you’ll be using for your paginated report. This dataset should contain all the necessary fields for your report, such as invoice details, sales data, or any other relevant information.
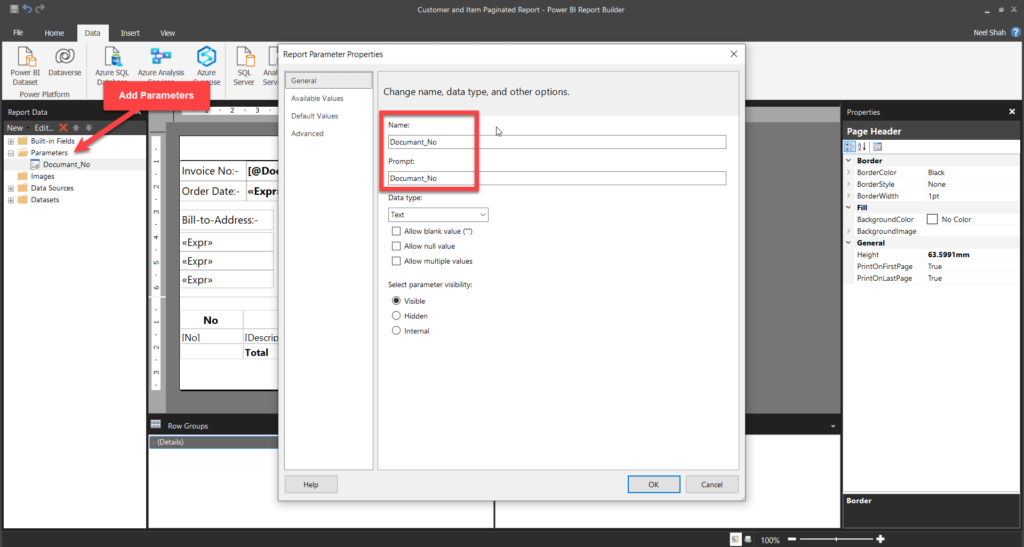
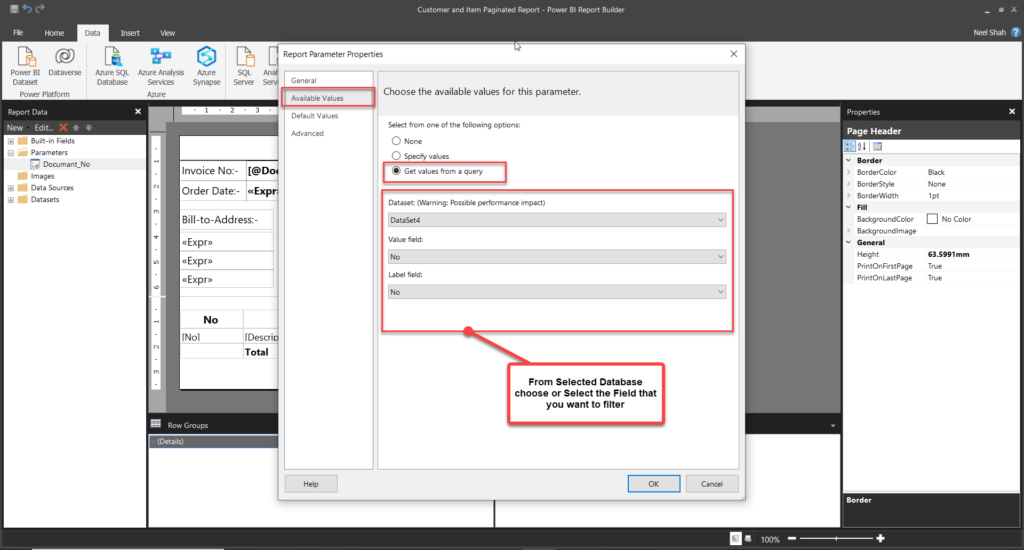
Adding Fields and Parameters
With precision and attention to detail, we curate the essential fields within the Query Designer, ensuring each element contributes to the coherent narrative of our report. Parameters are meticulously crafted to establish a seamless link between our Power BI and paginated reports, allowing for dynamic data filtration across both platforms.
Fine-Tuning and Validation
Refining the data representation, we employ parameter-driven filtration within the table, optimizing its content for relevance and precision. By customizing the tablix structure and initiating report validation, we ensure seamless functionality and performance.
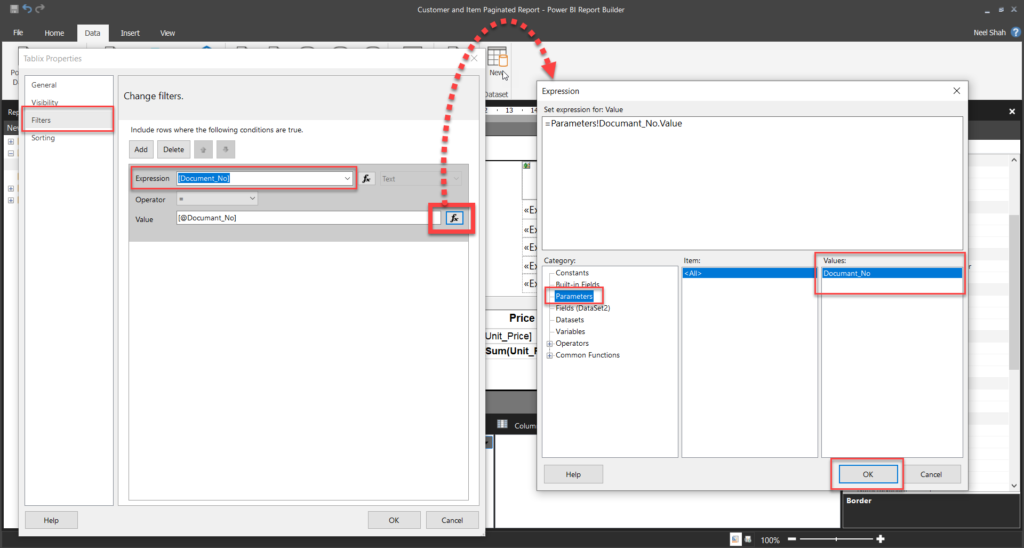
Once your report is designed, it’s time to fine-tune and test it. Review each element for accuracy and consistency. Test different scenarios and parameter inputs to ensure your report behaves as expected.
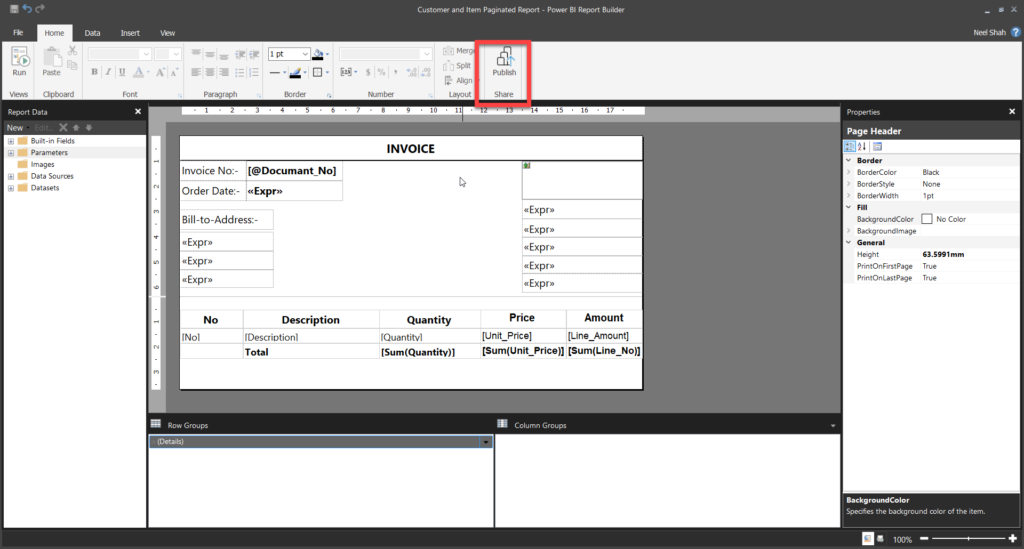
Integrating and Publishing
When you’re satisfied with your report, it’s time to publish it. Click on “Publish” to deploy your report to your Power BI workspace. From there, you can share it with colleagues or embed it into Power BI dashboards for wider distribution.
Enhancing with Drill-Through Actions
Consider adding drill-through actions to your paginated report for deeper analysis. Drill-through allows users to click on specific data points and navigate to related reports or detailed information, enhancing the interactive experience.
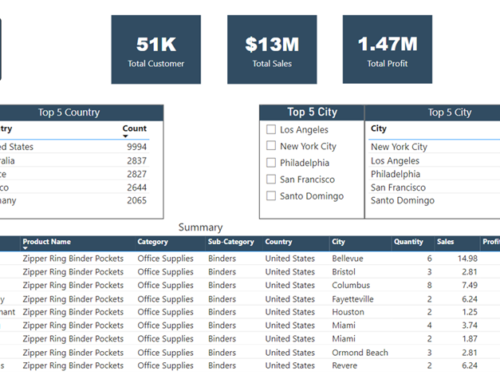
Integrate the paginated report seamlessly into your Power BI report by selecting the ‘Paginated Report’ option. This strategic choice establishes a cohesive connection, allowing for a unified and comprehensive presentation of dynamic insights within your Power BI environment.
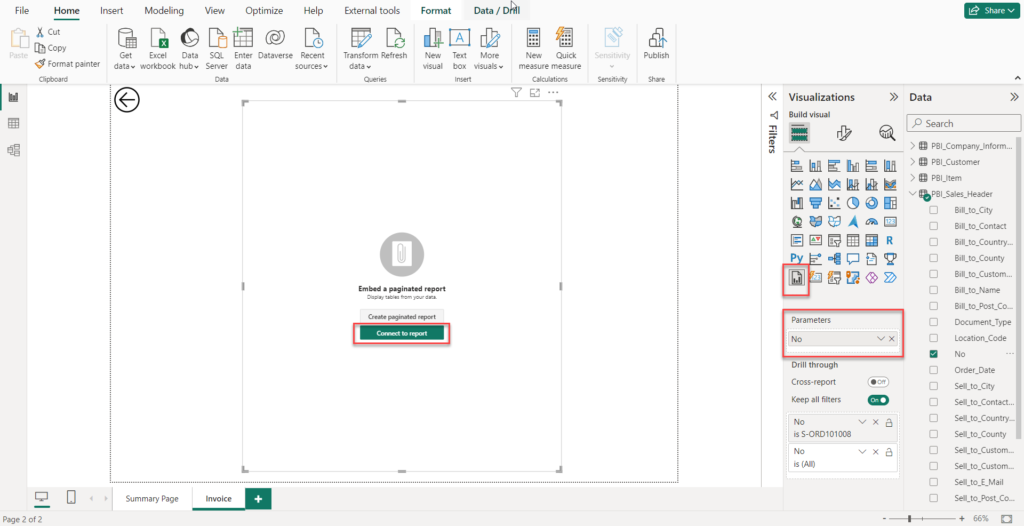
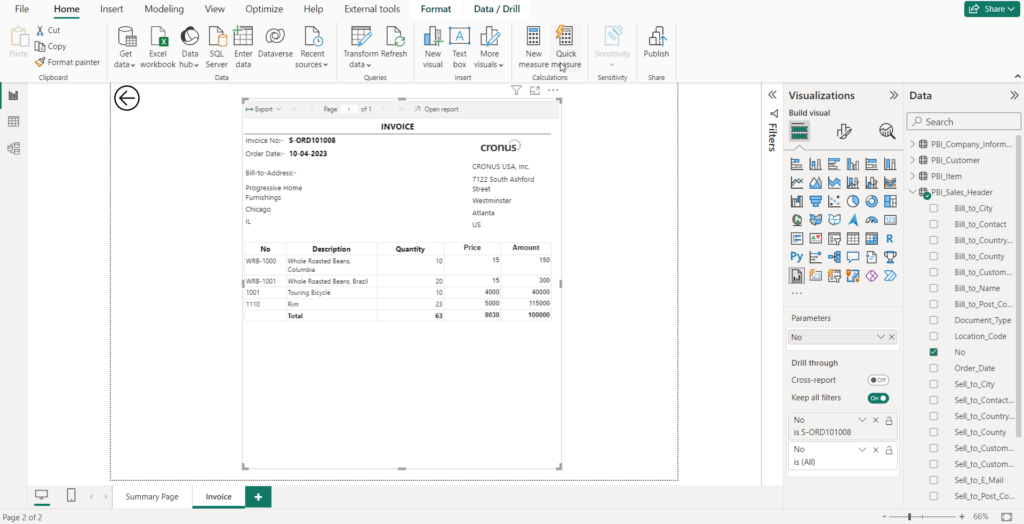
Add Your Created Report Here. After Add your Paginated report The page look like this,
Creating paginated reports is an iterative process. Gather feedback from users, monitor report usage, and iterate based on insights gained. Continuously improve your reports to better meet the needs of your audience over time.
Conclusion
Congratulations! You’ve now learn the art of creating paginated reports in Power BI. With your newfound skills, you can unlock the full potential of your data and deliver impactful insights to drive better decision-making across your organization.
