

In the vast landscape of Power BI, the Model tab stands as a treasure trove of capabilities. Among its hidden gems, the Parameter functionality is a game-changer often overlooked by many. This blog post will guide you through harnessing the power of Parameters to transform your data modeling experience in Power BI, unlocking instant insights and dynamic analysis with just a few clicks.
Leveraging Parameters for Tailored Measures:
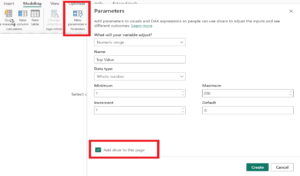
In Power BI’s Model tab, the Parameter functionality simplifies the creation of tailored measures for top values. Follow these steps:
- Input Numeric Values: Simply input your numeric values.
- Click ‘Create’: Watch as tailored measures effortlessly materialize.
- Dynamic Analysis: Enjoy quick and dynamic analysis, making the journey from raw data to actionable insights a breeze.
Witness the efficiency of Power BI in action as it automates and streamlines your data modeling experience. The power of Parameters lies in its ability to make your analytics journey smooth and tailored to your specific needs.
Unlocking Instant Insights:
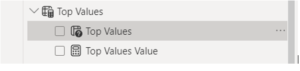
In Power BI’s Model tab, parameters set the stage for instant insights. With a click on ‘Create,’ measures materialize automatically and immediately. It’s a seamless process that demonstrates Power BI’s efficiency in turning raw data into actionable insights. ✨
Moreover, when the checkbox is selected, your slicer will be added to the page automatically, further enhancing the interactive nature of your reports.

Top N Functionality:
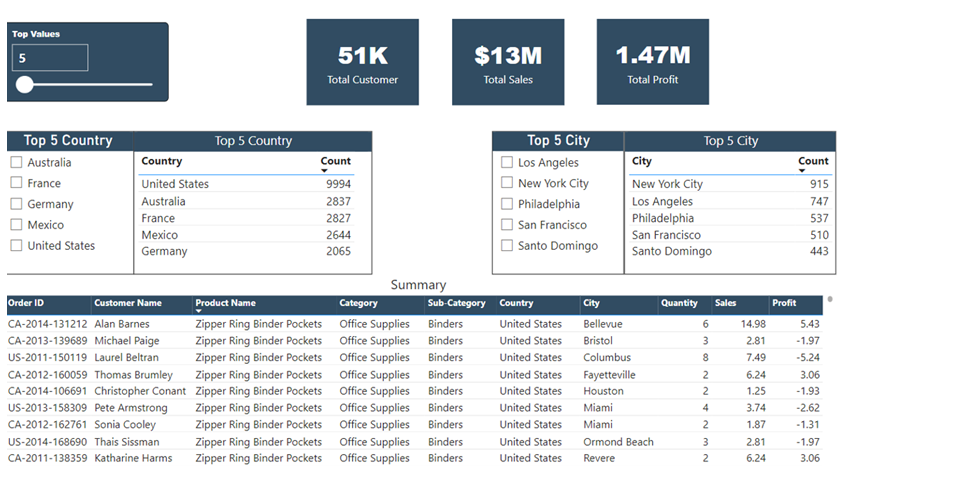
Power BI’s Top N functionality is a powerful tool for focusing on specific subsets of your data. Let’s explore how to highlight the top 5 countries and cities by the number of customers using this functionality.
Implementation Steps:
- Create a Measure (Count Rows):
- Formula:
Count Rows = COUNTROWS('Global-Superstore') + 0 - This measure lays the foundation for dynamic analysis based on top sales.
- Formula:
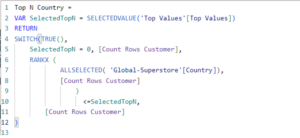
- Creating Measures for Top N Countries and Cities:a. Top 5 Countries Measure:
- Utilize DAX (Data Analysis Expressions) to create a measure that calculates the total number of customers for each country.
- Leverage the RANKX function to rank the countries based on the number of customers.
-
b. Cities Top N Values:
- Implement a similar approach based on the country to create measures for the top N cities.
Customizing Visualizations:
Leverage the flexibility of Power BI to customize visualizations based on your preferences. Whether it’s creating dynamic charts or interactive dashboards, Power BI allows you to tailor your reports to effectively communicate insights.
Conclusion:
In conclusion, the combination of Parameters and Top N functionality in Power BI’s Model tab offers a potent solution for dynamic data analysis. By following these steps, you can elevate your data modeling experience and unlock instant insights, making your journey from raw data to actionable results a seamless and efficient process. Harness the power of Parameters to transform the way you analyze and visualize your data in Power BI.

Leave A Comment
You must be logged in to post a comment.